Wetland Prioritization Study Main Page
Single-objective tools
- Ducks Unlimited Forested Wetland Restoration Suitability Model
- TNC-ELI DPWAP Potentially Restorable Wetlands Tool
- MTRI Wetland Mitigation Site Suitability Tool
- NHDES WRAM Site Identification Model
- Kauffman-Axelrod and Steinberg (2010) Scranton (2004) Tools for Identifying Restoration Consideration Areas
- Strager et al. (2011) Wetland Banking Site Selection Model
- VIMS Wetland Mitigation Targeting Tool
- WDNR Potential Opportunity Tool
- WDNR Potentially Restorable Wetlands Tool
Multi-objective tools
- TNC-ELI DPWAP Function Variety Assessment
- EPA RPS Recovery Potential Integrated Tool
- EPA RPS Social Context Tool
- Kramer et al. (2012) Potential Wetland Bank Site Index
- Maryland WRR Compromised Stormwater Infrastructure Restoration Tool
- Maryland WRR Riparian Zone Restoration Tool
- Maryland WRR Wetland Restoration Tool
- NOAA HPP MAHT Riparian Buffers (Restoration) Tool
- NOAA HPP MAHT Watersheds (River and Stream Restoration) Tool
- Kaufmann-Axelrod and Steinberg (2010) Tidal wetland prioritization tool
- Strager et al. (2011) Stream Banking Site Selection Model
- TNC WBSP Willamette Valley Synthesis Map
Ducks Unlimited Forested Wetland Restoration Suitability Model:1,2 This model evaluates site suitability for wetland restoration using Knowledge Engineer in ERDAS Imagine. The first step in Knowledge Engineer involves classifying each of five primary datasets (natural flood probability (NFP), soil moisture index (SMI), depressional sinks, stream buffers, and forest change) in either a binary fashion (high/low) or a non-binary fashion. The datasets classified in a non-binary fashion are NFP and SMI, with NFP separated into four classes and SMI into three. In the second step, a decision tree developed in Knowledge Engineer sorts particular pixels based on the combination of classifications for each individual dataset at that pixel's location. Another unique characteristic of Knowledge Engineer is that, based on the particular combination of classifications that result in a particular priority ranking for a parcel, confidence values are assigned for each pixel's categorization. The final output from Knowledge Engineer is that all pixels in the MAV study area are classified into one of the four priority classes (high, medium-high, medium-low, and low) and assigned a confidence value.
Factor used in analysis | Data source(s) |
Suitability factors | |
Natural flood probability (NFP) maps | Period of record stream gauge data (US Army Corps of Engineers, Vicksburg District); Landsat TM imagery (after 1982) |
Soil moisture index (SMI) | Landsat 7 ETM+ satellite imagery (acquired winter 1999) |
Depressional sinks | USGS National Elevation Dataset |
Forest change (1940's to 2001) | Landsat Multispectral Scanner (MSS) imagery; Landsat TM imagery; Landsat ETM+ imagery |
Stream buffers | USGS National Hydrography Dataset |
Exclusion factors | |
2001 forest cover | Landsat Multispectral Scanner (MSS) imagery; Landsat TM imagery; Landsat ETM+ imagery |
Permanent water bodies | Generated internally using summer imagery and low river levels |
Roads | ESRI dataset |
Urban areas | ESRI dataset |
Wildlife management areas | Data acquired from individual state agencies |
National Wildlife Refuges | USFWS National Cadestral Database |
National forests | Forest Service GeoData Clearinghouse |
Farm and home administration lands | Data provided by either NRCS or FWS |
Wetland Reserve Program project sites | NRCS geospatial database |
DU conservation easements | DU conservation easement geospatial database |
DU private landowner projects | DU private lands geospatial database |
Private landowner conservation projects of other conservation partners | Vector data acquired from conservation partners |
The Nature Conservancy and Environmental Law Institute Duck-Pensaukee Watershed Approach Pilot Project (DPWAP )Potentially Restorable Wetlands (PRW) Tool:3 A planning team identified reestablishment opportunities as sites that formerly supported wetland hydrology and vegetation and which currently had appropriate land cover for restoration. These sites were termed Potentially Restorable Wetlands (PRWs). PRWs were identified based on factors such as presence of hydric soils and appropriate current land cover and were integrated into the TNC-ELI DPWAP Wildlife Tool , Flood Abatement Tool, Surface Water Supply Tool, Water Quality Protection Tool, Carbon Storage Tool, Shoreline Protection Tool, and Fish Habitat Tool.
Factor used in analysis | Data source |
Hydric soils | NRCS SSURGO soils data |
Is not within an existing wetland | WDNR WWI wetland map data, converted to NWI format by USFWS |
Land use reflecting opportunity (e.g., agriculture) or lack of opportunity (e.g., urban, or existing natural cover) for successful wetland restoration | C-CAP (2001) land cover data |
Michigan Tech Research Institute (MTRI) Wetland Mitigation Site Suitability Tool (WMSST):4 MTRI combined eight statewide raster datasets in ArcGIS to score the feasibility of wetland restoration or creation for each pixel. Two of these layers, Topographic Wetness Index (TWI) and Soil Moisture Index (SMI), required additional processing by MTRI before they were integrated into the WMSST. The TWI was calculated based on slope and elevation data and served as a measure of the wetness at each site. The SMI was calculated based on the relationship between surface temperature and vegetation and served as a measure of soil moisture levels.
All eight data layers were first reclassified, based on feedback from Michigan Department of Transportation environmental personnel and published literature, to convert the original data values of each layer to values of 0, 25, 50, 75, and 100. For example, tables showing how original values were reclassified for the TWI and USDA SSURGO soils data are provided below:
| MTRI Topographic Wetness Index | ‹0 | 0 |
| 0.5-25 | 25 | |
| 25.5-50 | 50 | |
| 50.5-75 | 75 | |
| 75.5-100 | 100 |
| USDA SSURGO Drainage Class | Excessively Drained | 0 |
| Well Drained | 25 | |
| Poorly Drained | 50 | |
| Very Poorly Drained | 100 |
Reclassification ensured that all data layers, including those containing both nominal and interval data, used a standard scale. Once reclassified, each layer was clipped in order to divide each statewide layer into smaller areas that matched watershed and ecoregional boundaries to minimize the run-time of the final WMSST.
Factor used in analysis | Data source | |
Soil drainage class | USDA SSURGO drainage class data | |
Soil flood frequency | USDA SSURGO flood frequency data | |
Presence of hydric soils | USDA SSURGO hydric classification data | |
Soil ponding frequency | USDA SSURGO ponding frequency data | |
MTRI Topographic Wetness Index (TWI) | Slope | USGS Percent Slope Classification |
Elevation | USGS DEM | |
MTRI Soil Moisture Index | Relationships between surface temperature and vegetation levels | Landsat satellite imagery |
Percent slope | USGS Percent Slope Classification | |
Land cover | MNFI presettlement land cover data | |
The New Hampshire Department of Environmental ServicesWetland Restoration Assessment Model(NHDES WRAM) Site Identification Model:5 Starting with a composite layer of existing wetlands, the Site ID Model identified a set of 951 candidate sites for input into the Site Prioritization Model using a simple screening process involving the following steps:
- Some portion of the wetland must be assigned one or more of the following Cowardin classifications in the NWI: "partially drained/ditched," "diked/impounded," or "excavated."
- Any portion of the wetland must intersect any of the following land cover classifications from New Hampshire Land Cover Classification data: "barren lands," "orchard," "other agricultural," "hay/pasture or row crop," "disturbed land," or "other cleared lands."
- Candidate sites less than five acres in size were excluded because the literature suggests that restoration is most likely to be successful when working in wetlands at least five acres in size. The Technical Advisory Group, composed of state agency, regional planning commission, and nonprofit personnel, refined the candidate site list from here, removing and adding sites at their discretion.
Factor used in analysis | Data source |
Must have a Cowardin classification of "partially drained/ditched," "diked/impounded," or "excavated" | NWI |
Must have a land cover classification of "barren lands," "orchard," "other agricultural," "hay/pasture or row crop," "disturbed land," or "other cleared lands" | NHLCC (2001) |
Must be larger than five acres in size | NWI |
Kaufmann-Axelrod and Steinberg (2010) Scranton (2004) Tool for Identifying Restoration Consideration Areas:6,7 Scranton (2004) identified Restoration Consideration Areas (RCAs) as part of a process to delineate and classify tidal wetlands throughout Oregon by drawing upon a variety of datasets such as NWI data, head-of-tide locations, and other data. RCAs are "upland or non-tidal areas that might deserve closer scrutiny as possible candidates for restoration of tidal circulation, pending landowner involvement... These are generally lands that are diked or may have been partially filled or ditched for agricultural or commercial purposes." In total, Scranton identified 2264 RCAs throughout the state of Oregon.
Factor used in analysis | Data source(s) |
Aerial photography | Various imagery sources and years |
Wetland land cover | National Wetland Inventory |
Local Wetland Inventories | Oregon Dept. of State Lands |
Hydric Soils data | NRCS SSURGO |
Estuarine land cover | Oregon Dept. of Land Conservation and Development Estuary Plan Book |
Digital elevation models | USGS |
Head-of-tide locations | Oregon Dept. of State Lands |
Additional Resources | Fieldwork, wetland specialists, publications |
Strager et al. (2011) Wetland banking site selection model:8 Strager et al. (2011) identified potential wetland mitigation sites within HUC-10 watersheds by combining wetland soil type data from digital soil maps with a map of wetlands from the National Wetlands Inventory (NWI). The resulting wetland areas were then examined using aerial photos to remove areas from consideration in which development or conversion to impervious surface had occurred. Potential wetland areas identified in the aerial photos to contain natural land cover or permeable surface were selected for further evaluation in the subsequent rapid assessment analysis.
Factor used in analysis | Data source |
Historical wetlands on or adjacent to site | NWI wetland coverage |
Hydric or somewhat poorly drained soils | SSURGO soil coverage |
Non-permeable surfaces or natural land only | NLCD land use coverage |
Evidence of development or conversion to impermeable surface | 2006 color infra-red 1:12,000 Digital Ortho Quarter Quads (DOQQ) aerial photos with one meter resolution (flown during leaf-off) |
Potential wetlands with natural land cover or permeable surface |
The Virginia Institute of Marine Science(VIMS)Wetland Mitigation Targeting Tool (WMTT):9 The WMTT applies a hierarchical approach in which GIS layers representing different criteria for wetland restoration/creation are applied successively, in order of importance. As an area on the landscape satisfies more of these spatial criteria its suitability rank for the development and persistence of wetlands increases. This process begins with a raster land cover dataset, from which forested and agricultural land use types - considered to have a high probability of successful conversion to wetlands - are identified for further consideration as potential sites for wetland restoration or creation.
Within these areas, those containing hydric soils larger than 0.25 acres are ranked as "potential" restoration sites. Of these areas, those interecting streams (an indicator of hydrologic connectivity) are ranked as "moderate." Moderate areas adjacent to wetlands (an indicator of the likelihood that restoration will be successful) are then ranked "good" if they are forested and "high" if they are agricultural. The tool's higher preference for agricultural over forested land reflects the higher ecological values of maintaining forest buffers as well as the fact that agricultural lands meeting hydrology and hydric soil criteria are likely to be prior converted wetlands. Sites that were ranked "good" and are adjacent to conservation areas are elevated to "high," while those that were ranked as "high" and are adjacent to conservation areas are elevated to "excellent."
There was no formal collaboration with stakeholders during development of the tool - Center for Coastal Resources Management (CCRM) staff members were centrally responsible for developing the criteria and scoring system upon which the tool was based. However, because VIMS staff members are actively involved in wetland restoration and creation projects with area non-profits (e.g., the Elizabeth River Project) and government agencies (e.g., Department of Defense wetland restoration and creation), input from area stakeholders may have informally influenced the tool's development.
Factor used in analysis | Data source(s) |
Forested and agricultural land cover | NLCD |
Hydric soils | Virginia Tech GIS (VIRGIS); SSURGO |
Hydrologic connectivity | DLG hydrography |
Wetland polygons | NWI |
Conservation Lands | Virginia Department of Conservation/Natural Heritage Division |
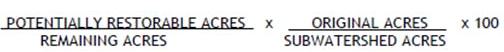
The Wisconsin Department of Natural Resources (WDNR) Potential Opportunity Tool:10 This tool evaluates the opportunity for wetland functional improvement through restoration across HUC-12 watersheds as indicated by the relative amount of Potentially Restorable Wetlands (PRWs) and the original percentage of wetlands in the watershed. WDNR assesses potential opportunities using the equation below.
Factor used in analysis | Data source(s) |
Hydric soils | SSURGO soils data |
Not within an existing wetland | DWWI wetland mapping data; other sources of wetland mapping data (e.g., county-level sources, if available) |
Land use reflecting opportunity (e.g., agriculture) or lack of opportunity (e.g., urban) for successful wetland restoration | Milwaukee study used SEWRPC augmented by WISCLAND land cover and US Census TIGER/Line road data; Rock River study used NASS cropland GIS data |
The Wisconsin Department of Natural Resources (WDNR) Potentially Restorable Wetlands (PRWs) Tool:11 This tool identifies restoration opportunities across the landscape and is composed of the combined boundaries of hydric soils, existing wetlands, and land use datasets. WDNR classifies areas as potentially restorable if they: 1) contain hydric soils, 2) do not overlap the location of existing wetlands, and 3) are not developed.
Factor used in analysis | Data source(s) |
Hydric soils | SSURGO soils data |
Not within an existing wetland | DWWI wetland mapping data; other sources of wetland mapping data (e.g., county-level sources, if available) |
Land use reflecting opportunity (e.g., agriculture) or lack of opportunity (e.g., urban) for successful wetland restoration | Milwaukee study used SEWRPC augmented by WISCLAND land cover and US Census TIGER/Line road data; Rock River study used NASS cropland GIS data |
Wetland Prioritization Study Main Page
1Shankle, S, Brown, D, Holden, J. Site suitability modeling for the restoration of forested wetland in the Mississippi Alluvial Valley.
2Feedback received on 5/10/2012 from Dale James, Manager of Conservation Planning, Ducks Unlimited.
3 Miller, N., T. Bernthal, J. Wagner, M. Grimm, G. Casper, and J. Kline. 2012. The Duck-Pensaukee Watershed Approach: Mapping Wetland Services, Meeting Watershed Needs. The Nature Conservancy and Environmental Law Institute, Madison, Wisconsin.
4 Brooks C, Powell R, Shuchman R, Leonard G. Developing and applying a geospatial decision support tool for efficient identification of wetlands mitigation sites.
5 Vanasse Hangen Brustlin, Inc. 2009. Merrimack River Watershed Restoration Strategy. Prepared for New Hampshire Department of Environmental Services.
6 Interview on 12/19/2011 with Jennifer Axelrod, FLO Data and GIS.
7 The application of geographic information systems for delineation and classification of tidal wetlands for restource management of Oregon's coastal watersheds. Masters Thesis, Marine Resource Management Program, Oregon State University.
8 Strager MP, Anderson JT, Osbourne JD, and Fortney R. 2011. A three-tiered framework to selection, prioritize, and evaluate potential wetland and stream mitigation banking sites. Wetlands Ecology and Management 19:1-18.
9 Berman MR, Rudnicky T, Berquist H, and Hershner C. 2002. Protocols for implementation of a GIS-based model for the selection of potential wetlands restoration sites in southeastern Virginia. Center for Coastal Resources Management, Virginia Institute of Marine Science, College of William and Mary. Gloucester Point, Virginia.
10 Hatch B, Bernthal T. 2008. Mapping Potentially Restorable Wetland in the Rock River Basin.
11 Kline J, Bernthal T, Burzynski M, Barrett K. 2006. Milwaukee River Basin Wetland Assessment Project: Developing Decision Support Tools for Effective Planning.